ABOUT
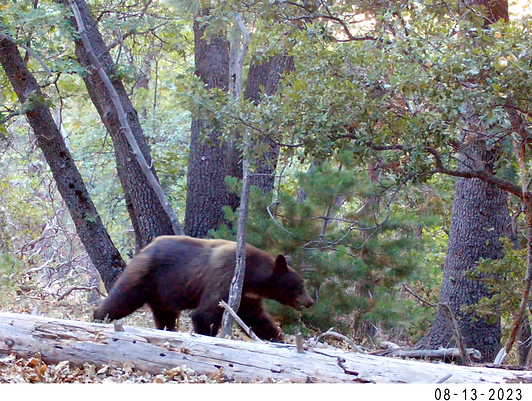
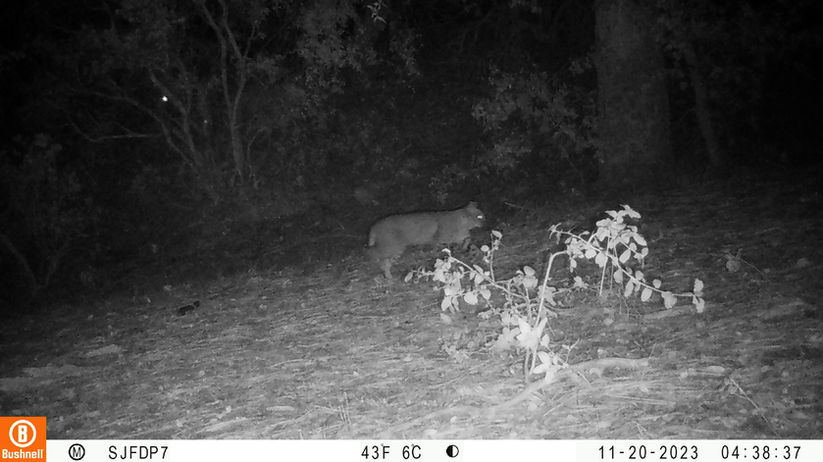
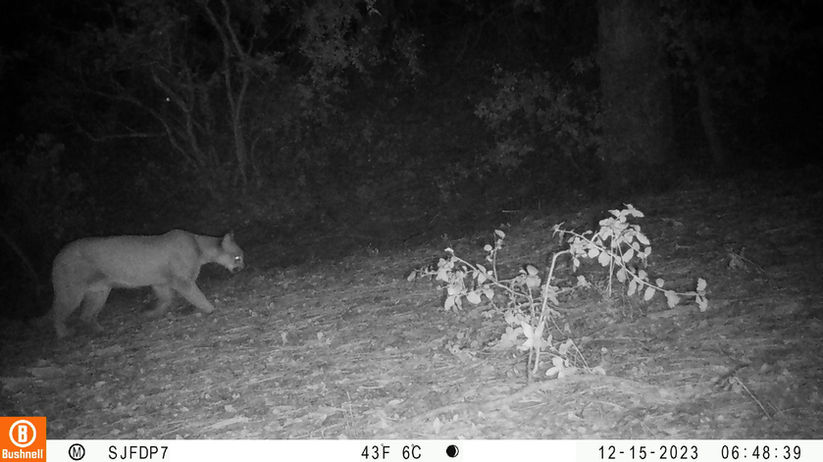
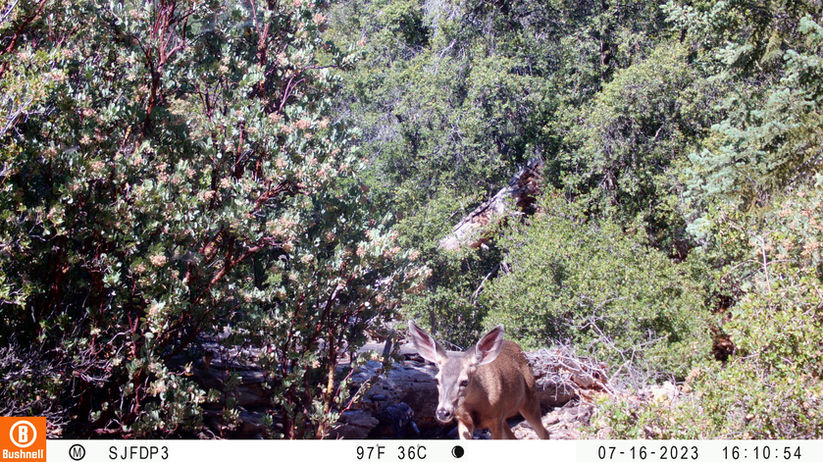
We installed wildlife camera traps throughout our forest dynamics plot to gain a better understanding of the wildlife species, interactions, and activity to inform our current research on forest demography.
.png)
.png)
GOALS
We placed eight wildlife camera traps throughout the forest plot, capturing photos and videos to (1) identify the unique species in the area, (2) estimate species occupancy differences with location, and (3) to assess activity patterns of wildlife. Learn more at https://wildriverside.ucr.edu/
HIGHLIGHTS!
These figures describe the makeup of species found in the forest plot, categorized into large mammals, small mammals, and birds.
-
the charts visualize the make-up and identities of the species
These figures describe the activities (sightings) for different bird, small mammal, and large mammal species.
-
orange shades denote bird species
-
blue shades denote large mammal species
-
red shades denote small mammal species
These figures visualizes animal observations, dynamically showing month-to-month (June to November 2023) abundances.


